


Social Media Links
Trusted Financial Apps
My Trusted Brokers
My Trusted Propfirms
Download
🥇 XAUUSD Trading Strategy
Optimized for 1-Hour Charts (Long Bias)
📈 Trading Strategy
XAUUSD ONLY
This strategy is specifically designed for Gold trading
🎯 1. Trend & Signal Check
Add three Exponential Moving Averages (EMAs): 12, 21, and 50. Or download my FREE TradingView Indicator and add the 2nd Indicator Volume and set the 20 MA for volume.
📈 Buy signal: When both the 12 EMA and 21 EMA cross above the 50 EMA and all three turn green.
📉 Sell/Short signal: When the 12 and 21 EMAs are below the 50 EMA and appear red.
🔍 2. Market Structure Confirmation
Only consider entering a trade when a BOS candle closes and the trading volume is higher than the 20-period moving-average volume.
If you want to know how I identify a valid BOS and MSB on 1-hour timeframes? Get my mentorship now!
🚀 3. Entry
Enter a buy or short position right after the candle closes that confirms the BOS and meets the volume requirement.
🛡️ 4. Stop-Loss Placement
Set your stop loss at the previous swing low created by the BOS.
Mark this area as your "Swing Box" for easy reference.
🎯 5. Take-Profit Target
Use a 2:1 Reward-to-Risk (2RR) ratio for the initial take profit.
📐 Fibonacci Levels for Trade Management
Apply the Fibonacci retracement tool with these levels: 0, 0.25, 0.5, 0.70, 0.75, and 1.
Draw the retracement from your entry point up to the take-profit target.
⚖️ 0.75 Management Rule
If price reaches the 0.5 Fibonacci level, move the stop loss to breakeven.
If price then closes below the 0.75 level, exit the trade to lock in profits even if the main target hasn't been hit.
⚡ Optional Higher-Risk Method
Open two positions of equal size instead of one.
Close the first position once the 2RR target is reached.
If no new MSB occurs after hitting 2RR, keep the second position open.
Close that final position as soon as a new MSB appears.
📄 How to use the FREE EMA Indicator
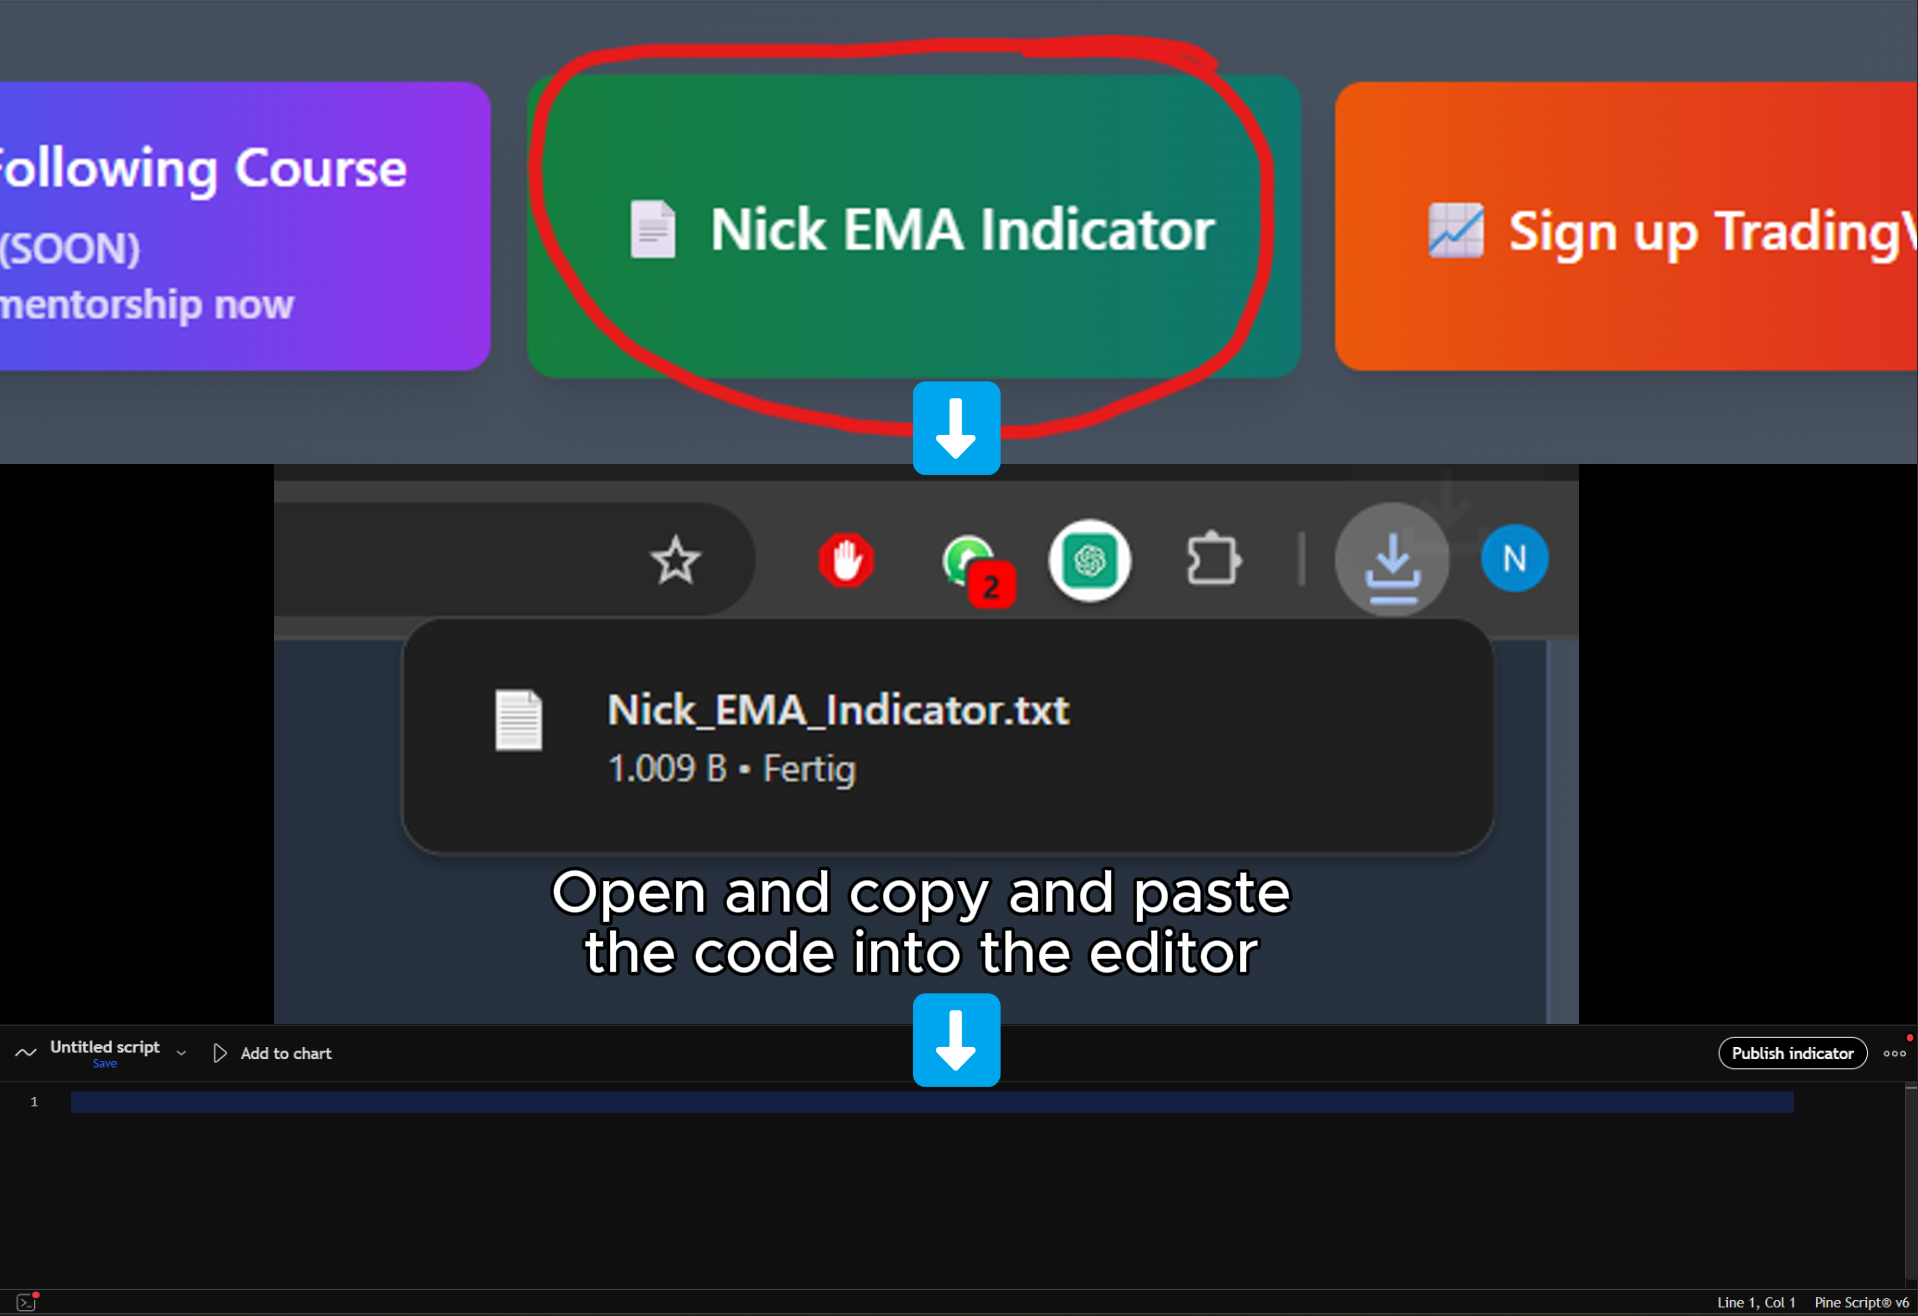
My custom EMA indicator is completely free! Follow these steps to set it up on TradingView. The code can be found by pressing the "Nick EMA Indicator" button.
-
Click the "Pine Editor" button at the bottom of your TradingView chart.
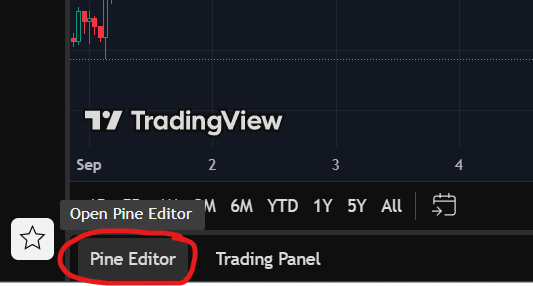
-
In the Pine Editor, click the "Open" button with the up arrow icon, then select "Create new" and "Indicator".
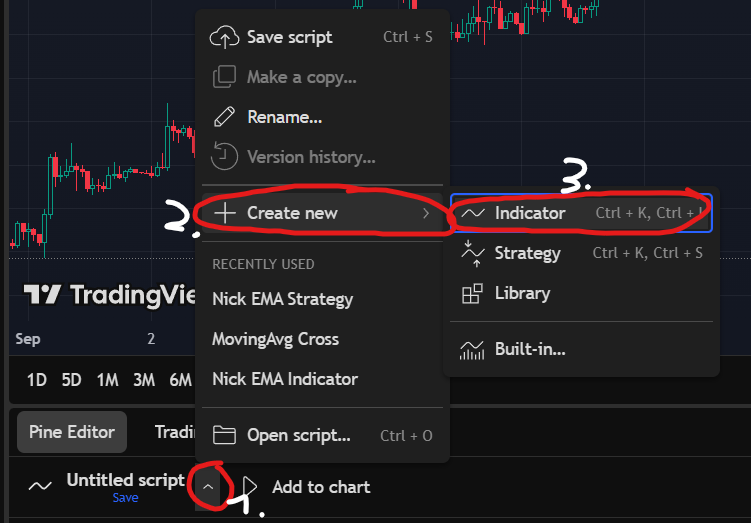
-
A blank script will appear. Delete all the default code. Open the indicator code file you downloaded, copy everything, and paste it into this blank window.
-
Click the "Add to chart" button at the top of the Pine Editor. The indicator is now applied to your chart.

📸 My Trading Journal
A look at my past trades
📊 Trading Statistics
Performance at a glance